- Overview
- Debugging workflow
- Debugging workflow: CI
- Basic interface
- Visualizing control flow
- Call stacks
- Explaining dataflow
- Multiprocess
- Search box
- Source files
- Condition and print expressions
- Toolbox
- Alerts
- Application logs
- Callees
- View operators
- Notebook
- Instruction execution
- Javascript
- Browser UI integration
- Screenshots
- Additional views
- GDB
- System debug info
- Compiler issues
- The Pernosco vision
- Related work
Debugging workflow: CI
Many modern workflows aren't amenable to interactive debugging. When a test fails in CI, or a component is failing in a distributed system, it's difficult or even impossible to attach a debugger. Most interactive debuggers need to stop the program to inspect the state, and stopping a program may cause it to be killed by a supervisor or trigger unacceptable cascading failures. rr and Pernosco solve this problem.
We have implemented Pernosco support for debugging Github Actions test failures, and also built Pernosco integration with customers' bespoke CI. If you are interested in free Pernosco support for your GHA-using open source project, or buying GHA or custom CI integration for a closed-source project, contact us.
Using Pernosco With Github Actions
You install our Pernosco Github app and enable Pernosco for selected Github Actions steps:

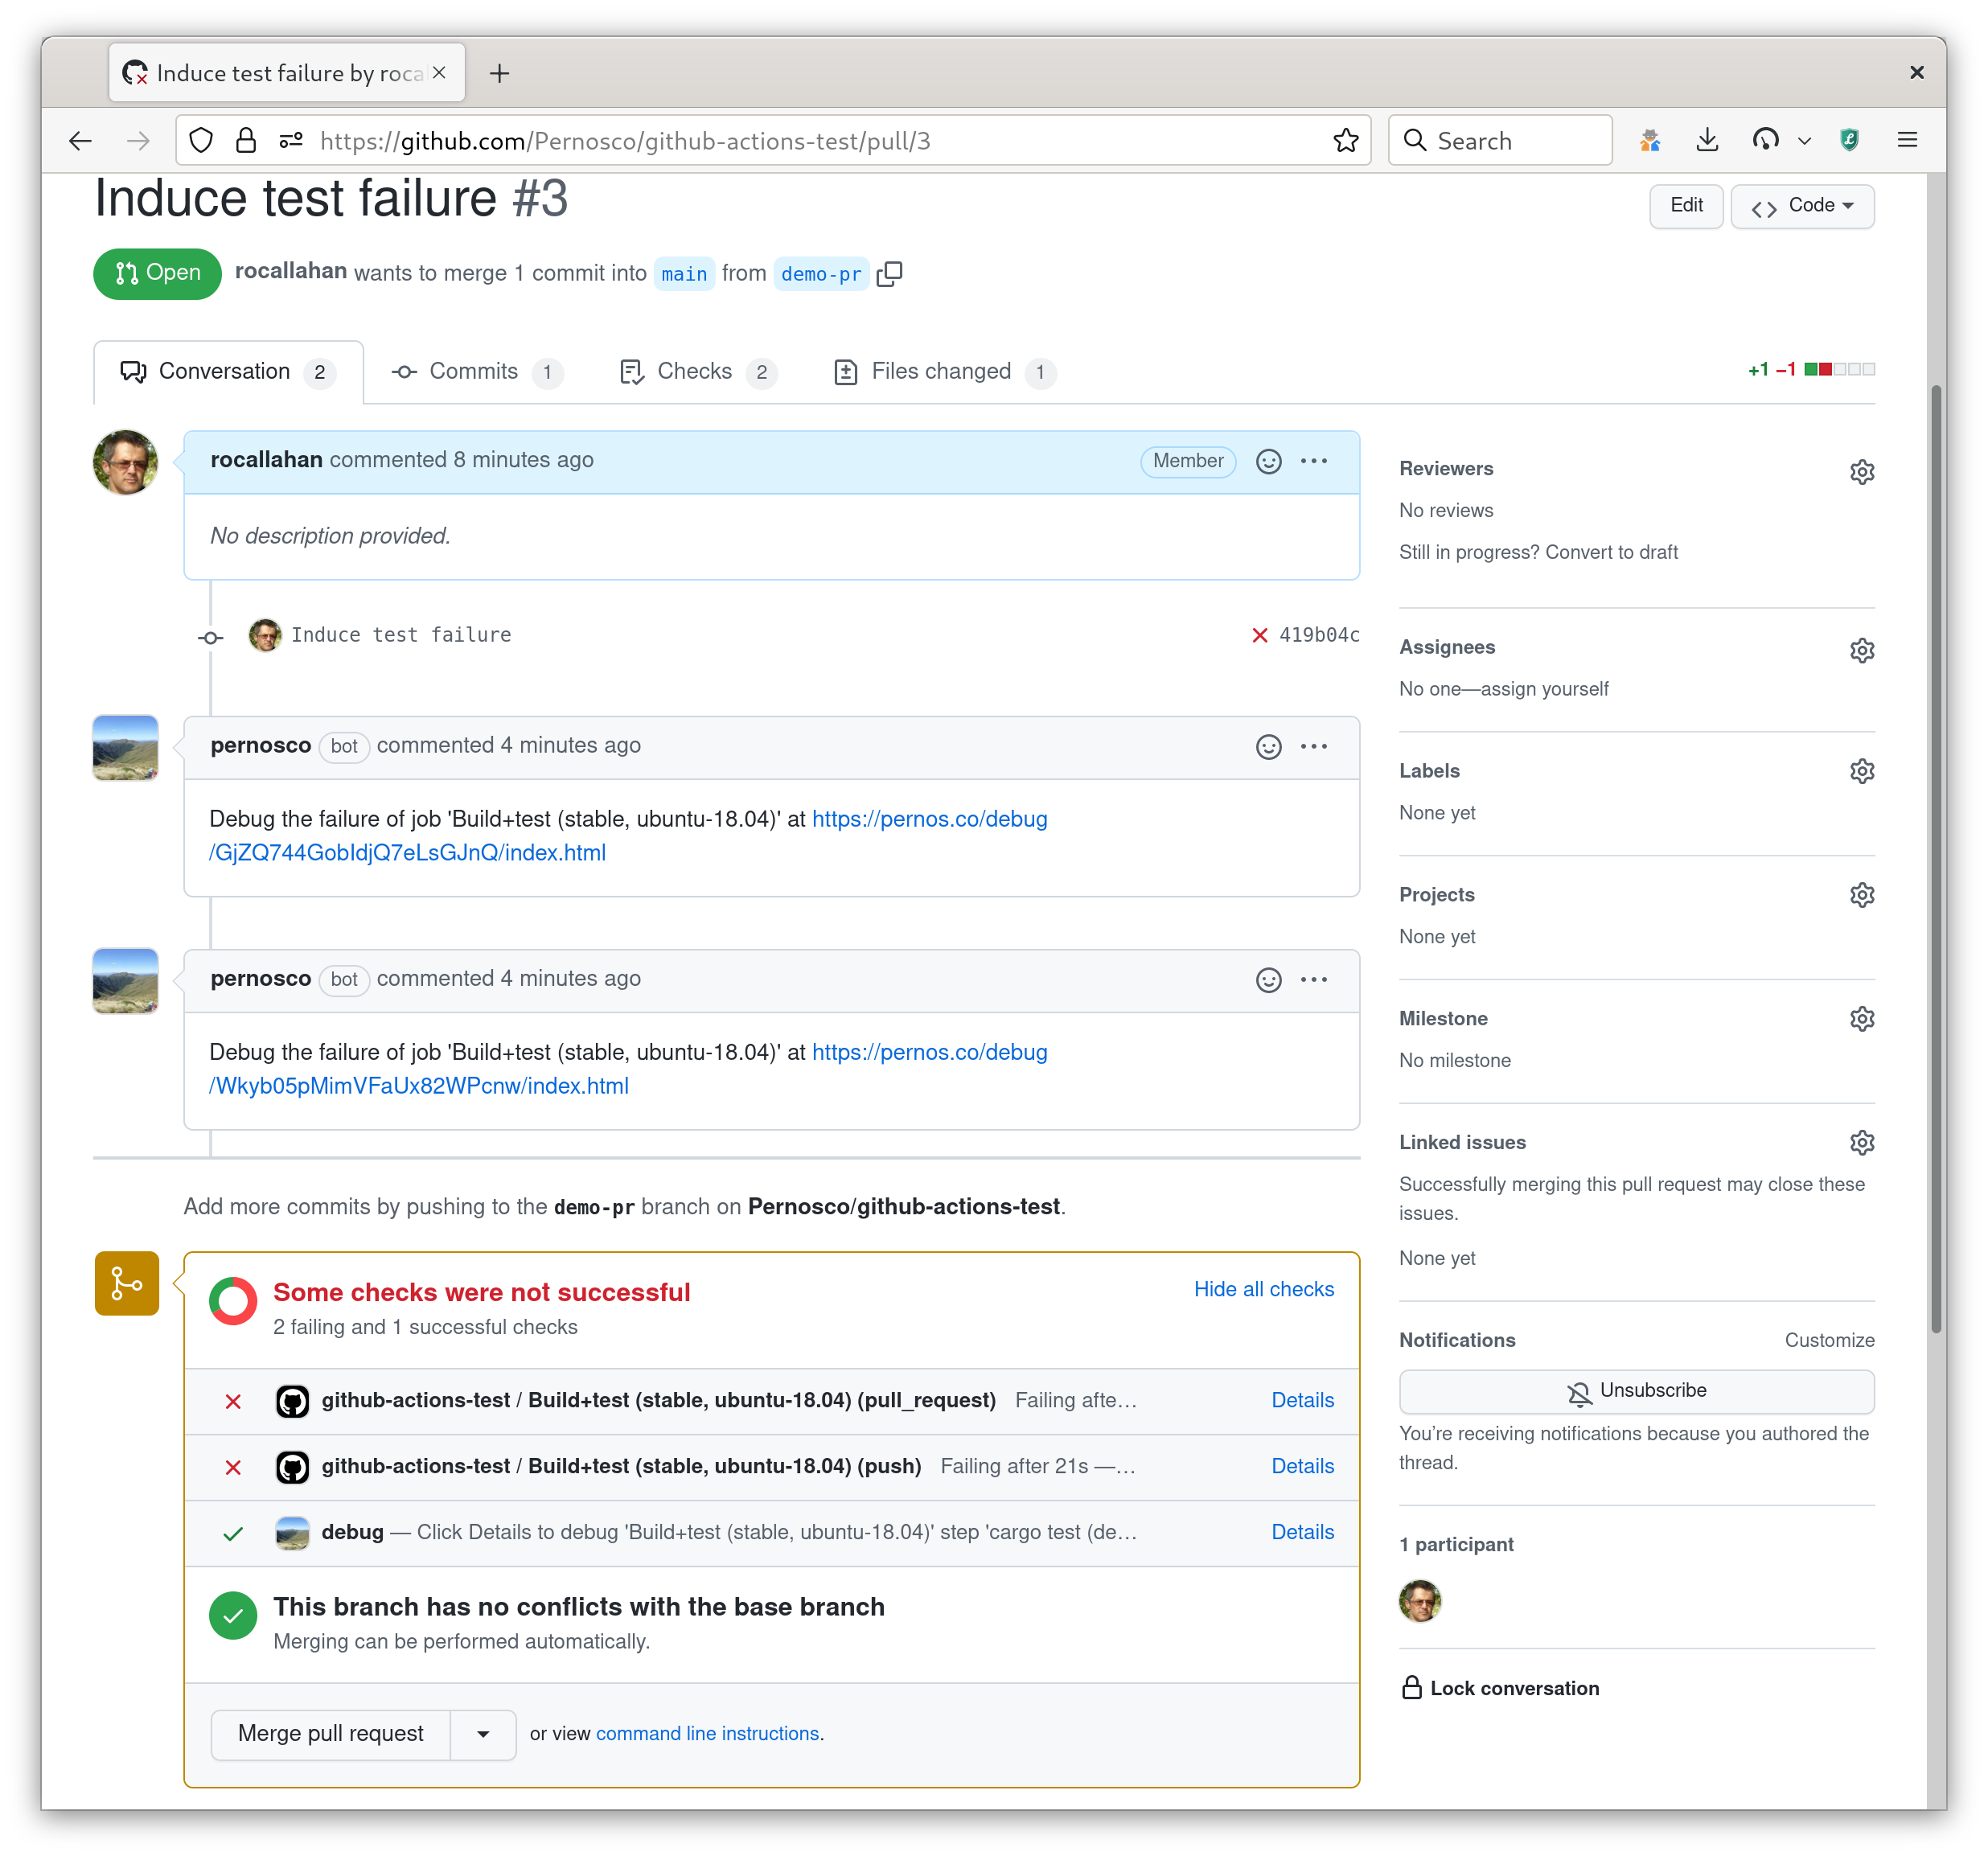
When a Github Actions test fails, Pernosco observes the failure and automatically reruns the failing test, recording and analyzing the failure to produce a Pernosco debugging session. (This only works for authorized repositories — contact us first.) When this is successful, a link to the debugger is posted to Github:

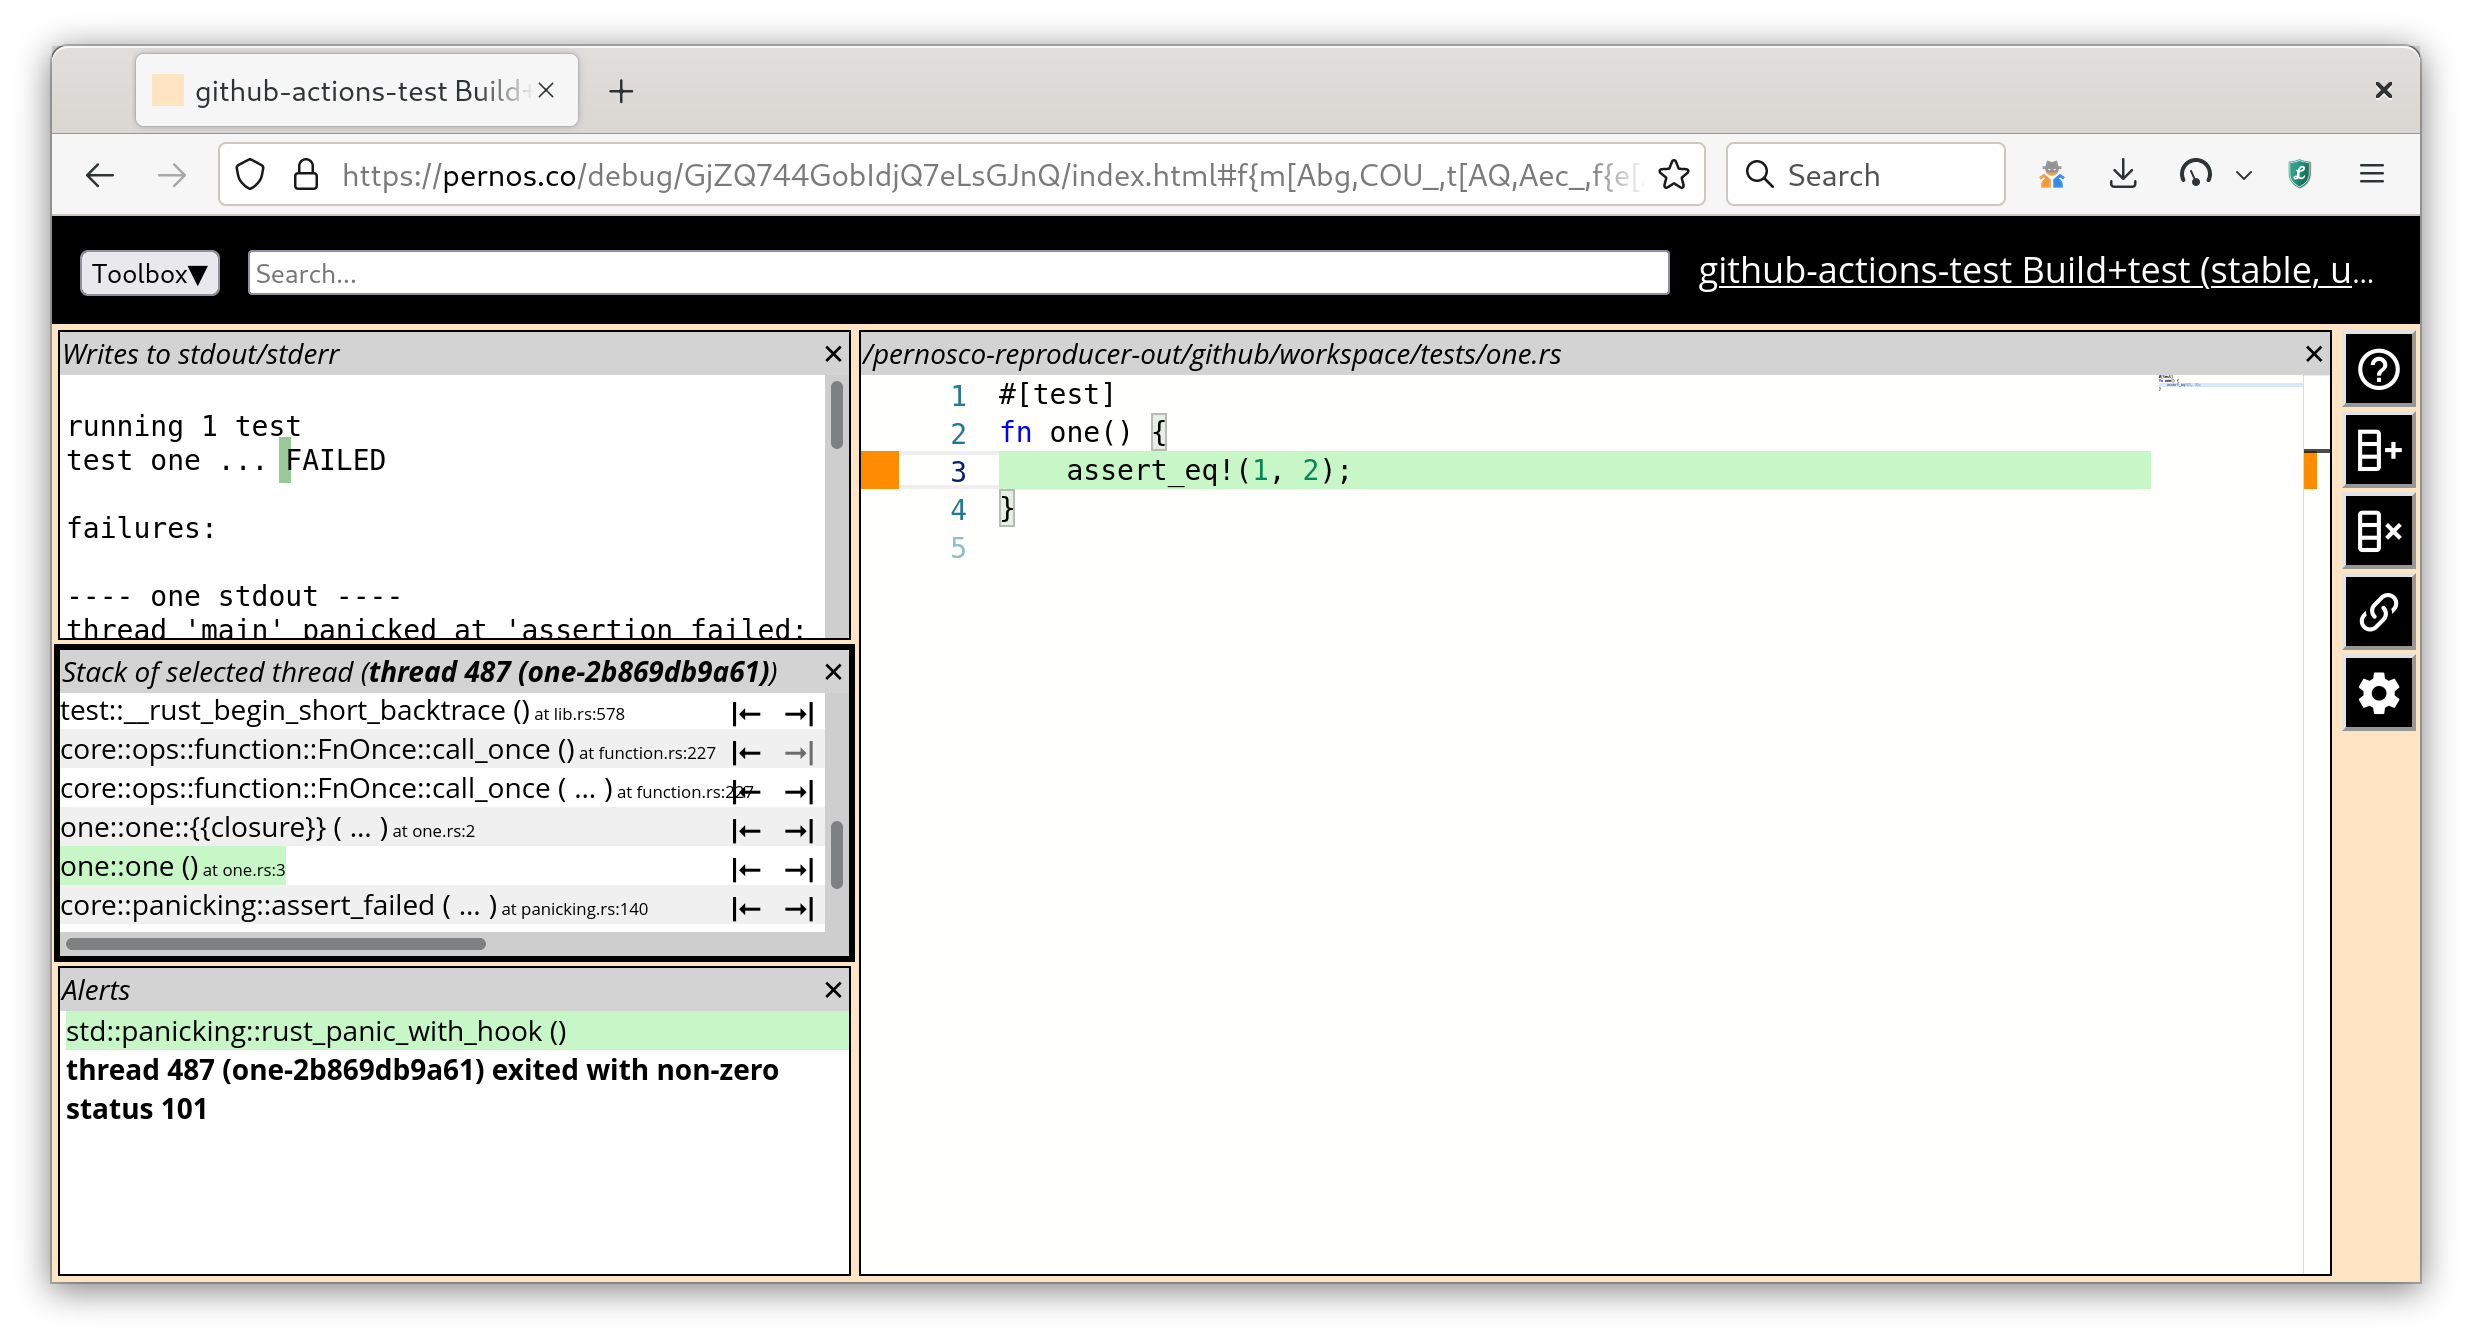
Click on the link to enter the Pernosco debugger and debug the bug:

Compare this to the effort required to rerun and debug the test locally, or to multiple cycles of enabling extra logging and re-pushing to figure out the problem.
Firefox CI
Many CI frameworks exist, and many projects have their own. Some work is required to integrate Pernosco with each one.
Firefox developers validate their changes before commit by pushing them to a Mozilla 'Try server' which runs automated tests on them. Pernosco detects test failures on the Try server, then reproduces, records and processes those failures, notifying developers by email when Pernosco sessions are available. Clicking on a link to debug is much more convenient than having to reproduce the test failure locally.

To simplify debugging, our test reproducer stops the recording as soon as the first test in a suite has failed. Sometimes developers want to debug a different test failure. To support that, we offer a dashboard where developers can view each test that failed and select them individually for reproduction and debugging with Pernosco.
Intermittent test failures
Our CI support primarily targets reproduction of deterministic test failures, and re-runs each failing test suite just once by default. We also support rerunning a failed test suite multiple times (with rr chaos mode) to enable reproduction and debugging of intermittent test failures.