Pernosco Blog
Where Should the Debugger Set a Breakpoint?
When you search for executions of a function in Pernosco (or set a breakpoint in a more traditional debugger), how does the debugger decide where to stop? You might think it just stops at the first instruction in a function, but that's not true in general.
Debuggers actually stop immediately after the function's "prologue", and for good reason. At -O0, compilers generally do not produce accurate debug information for the function prologue, and stopping any earlier would lead to the debugger seeing incorrect parameter values. That, in turn, would produce the wrong results when evaluating conditional breakpoints. Finding the end of a function's prologue can be surprisingly difficult though. In this article I'll go through why this is an issue, and some of the heuristics involved in determining where to place a breakpoint.
Implementing Pernosco Support For Github Actions
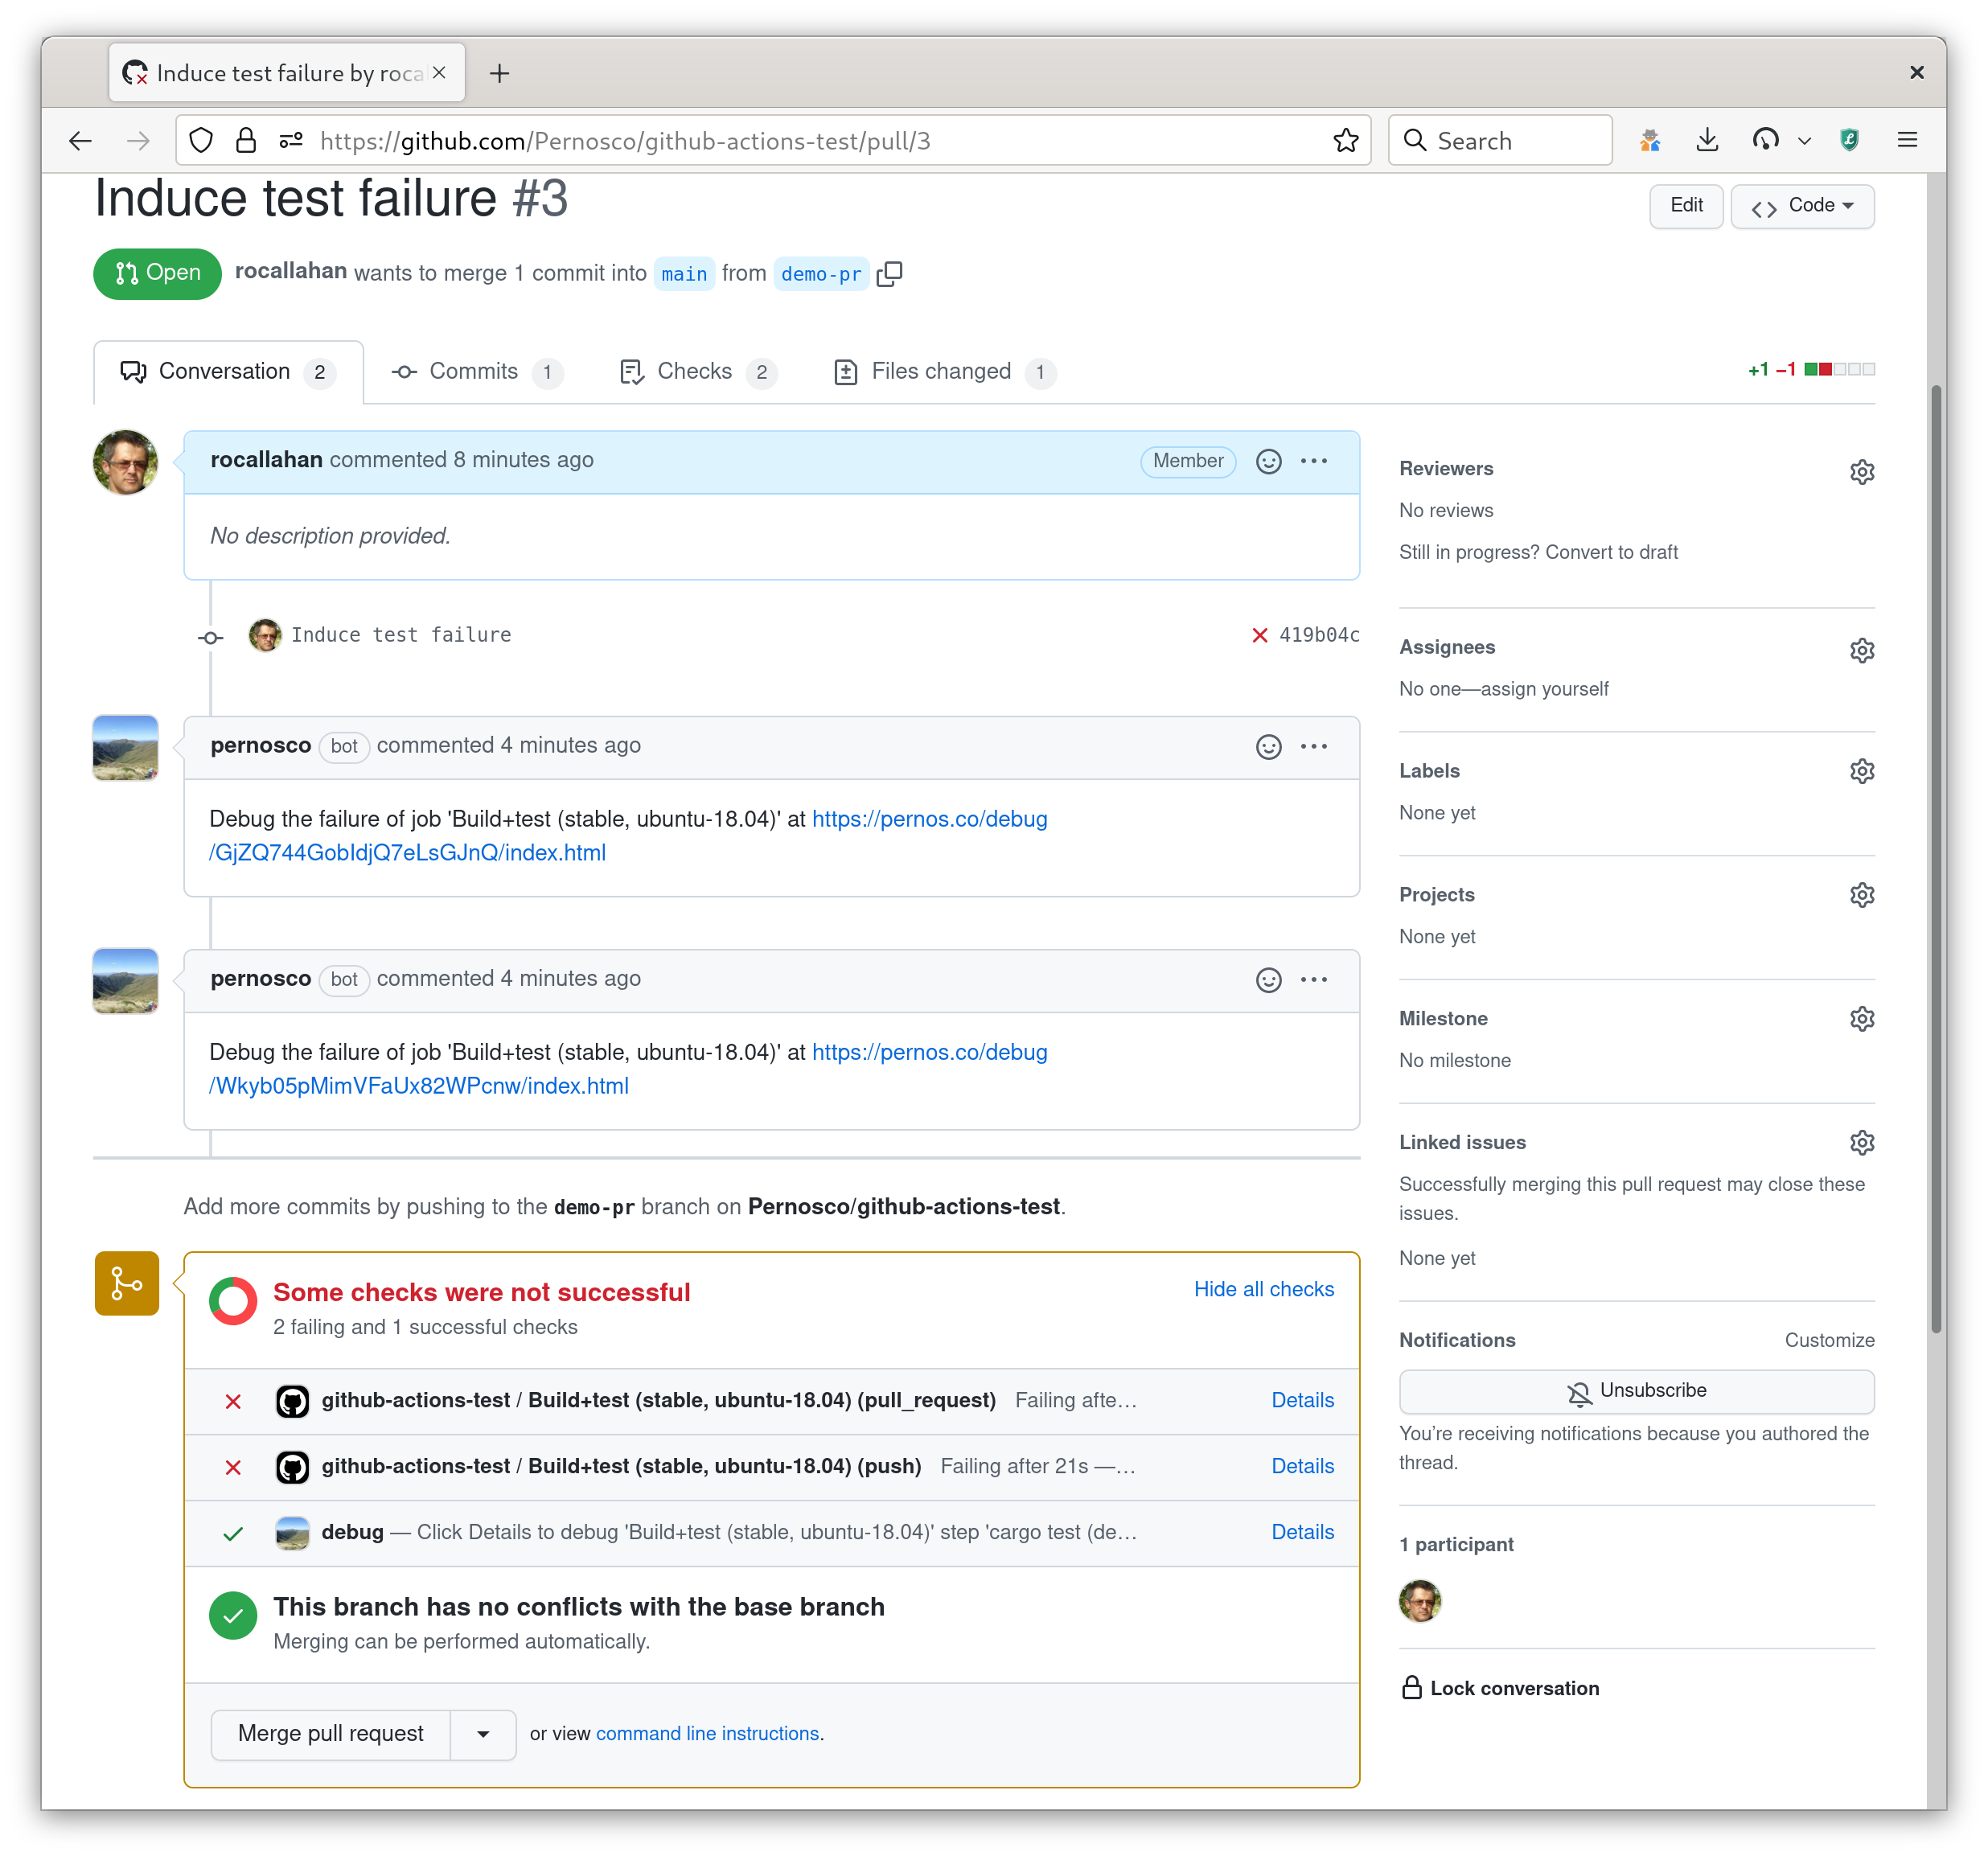
Pernosco supports debugging failures in Github Actions tests. When a test fails, you get a link that takes you directly to debug that failure:

(If you want Pernosco debugging for the Github Actions of your open-source project, contact us.)
Implementing this required reimplementing (some of) Github Actions workflow execution. We have just published our gha-runner implementation of Github Actions (as a Rust library). You can use gha-runner to run Github Actions workflows locally, and it has extension points to let projects like Pernosco modify how workflows are executed. gha-runner contains an example that lets you run Github Actions steps locally under strace, e.g.:
rr Trace Portability: TZCNT
When we introduced trace portability to rr our primary goal was to enable use cases like Pernosco, where traces would be recorded on one machine and replayed on another for advanced analysis. At the time it was an open question exactly how portable these traces would be, but for the most part the x86 architecture is well behaved enough that things just work. As Pernosco usage has grown we have ingested traces from a larger collection of systems and discovered a few subtle differences. We have previously written about emulating RSQRTTSS and other "approximate" floating point instructions which produce different results on Intel and AMD processors. The most recent issue we've come across is related to the TZCNT instruction.
More...Debugging Dataflow Through Pipes And Sockets
One of the most powerful features of the Pernosco Omniscient Debugger is using dataflow analysis to track a value back to its origin. We recently made this even more powerful, by giving it the ability to track values that flow through pipes and through sockets (when traces are recorded with rr 5.5).
More...